The Astrophysics Spectator
The Astrophysics Spectator
The great difficulty encountered in astronomy is that, with the exception of rarities like the supernova, stars are stuck in time, giving us no direct notion of how they change over the billions of years of their lives. The collection of stars we see on the sky are of all ages, sizes, and compositions. From this collection, astronomers infer how a star changes as it ages, and how this change depends on the mass and the composition of the star.
If you don't understand how a collection of objects behave, throw the objects onto a chart and see if any patterns pop out at you. The obvious two characteristics to use when plotting stars are color and absolute visual magnitude. Such a plot is called a Hertzsprung-Russell (HR) diagram. By tradition, the absolute visual magnitude runs along the vertical axis, going from low luminosity (large, positive values of magnitude) to high luminosity (negative values of magnitude) when going from bottom to top, and the color along the horizontal axis, going from blue to red when moving from left to right.
The absolute visual magnitude (MV) serves as a proxy for luminosity, and the color is a proxy for the photospheric temperature. Absolute visual magnitude and color work well as proxies, because stars have spectra that are nearly black-body spectra. The power emitted in the visual wave band increases with the total power emitted when the radiation is black body, which is why the observable visual magnitude can be used in place of the generally-unobservable luminosity.
The color is measured by taking the difference of the apparent magnitudes measured in two narrow frequency bands. Commonly, one band is spectroscopic blue, and the other band is spectroscopic yellow. Under one common photometry system?a system that defines color filters for measuring the starlight?the blue color is defined as the apparent magnitude B, the yellow color is defined as the apparent magnitude V (for visual), and the color is the difference B ? V, with the bluest stars having a negative value (e.g. ?0.35 for an O star), and the reddest stars having a positive value (e.g. +1.6 for M stars). This may seem backwards, since it implies that B is less than V when more blue light than yellow light is being emitted, but remember that the magnitude scale is inverted, so that the larger the amount of light, the smaller the magnitude.
Color serves as a proxy for temperature, because the peak of a black-body spectrum rises proportionally with temperature. When the temperature is low, the amount of blue light is considerably less that the amount of yellow light, but when the temperature is high, the amount of blue light exceeds the amount of yellow light. As long as the temperature is not too high, so that the peak of the black-body spectrum is not too far way from the color bands, the amount of blue light to yellow light increases with temperature. This works well for most stars, but for neutron stars it fails, because with a temperature typically in the x-ray band, the black body spectrum over the visible bands is proportional to the frequency squared; whether the temperature is 0.5 keV or 2 keV, the ratio of blue to yellow light is unchanged. But for the stars burning hydrogen and helium, where the photospheric temperatures are below 50,000K, color works well as a measurement of temperature. Only the very brightest hydrogen-burning stars have colors that are relatively insensitive to temperature.
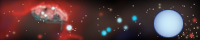
The diagram below shows a Hertzsprung-Russell diagram for stars from the Hipparcos catalog. The stars plotted on this diagram have apparent visual magnitudes less than 5 (brighter than 5th magnitude), and an annual proper motion of more than 20 milli-arc-seconds (a distance of less than 50 parsec). The limiting apparent visual magnitude of 5 was chosen because it gives a set of stars visible to the unaided eye on a clear night; the limiting magnitude of the Hipparcos survey is slighter larger than 7, while selected stars with apparent visual magnitudes over 10 were also observed. There are 488 stars on this plot, including familiar stars such as Sirius ( Canis Majoris), Rigil Kentaurus ( Centauri), and Pollux ( Geminorum).

The Hertzsprung-Russell Diagram for stars from the Hipparcos Main Catalog with apparent visual magnitude ? 5 and annual parallax ? 20 milli-arc-seconds.[1] The horizontal axis gives the difference between the apparent visual magnitude and the apparent blue magnitude. The vertical axis gives the absolute visual magnitude. Each star is plotted as a light-blue box. Regions of darker blue are where the data points overlap; the darker the color, the larger the number of overlapping data points. The plot contains 488 stars. The data was obtained through the VizierR Service of Centre de Donnes astronomiques de Strasbourg (CDS).
Two features stand out on the diagram: most of the stars fall along a serpentine diagonal band that extends from the red, low-luminosity region to the blue, high-luminosity region, and a smaller number of stars cluster in the red, high-luminosity region.
The broad band of stars is called the main sequence, and it comprises the stars that burn hydrogen at their cores. Most stars are on the main sequence, because most of a star's thermonuclear-fusion life is spent burning hydrogen. Both Sirius and Rigil Kentaurus ( Centauri) lie on the main-sequence, as is shown in the diagram. The Sun on this plot would fall just below Rigil Kentaurus. The left of the main sequence curves upward because the peak of the black-body spectrum fall above the blue channel at high temperature, as was discussed above; a star can only get so blue, it can't get pure blue.
Because only bright stars are plotted in the diagram on this page, the main-sequence is truncated over the red region. The diagram therefore gives the misleading impression that few main-sequence stars are less luminous and more red than Rigil Kentaurus, when in fact the opposite is the case. The main-sequence band continues down to somewhat redder colors and to much lower luminosities, and comprises many of the closest stars, including Proxima Centauri, which has an absolute visual magnitude of over 15. These stars are excluded because their apparent visual magnitude is greater than 5.
The length of the main sequence reflects the range of stellar masses. The low-mass stars are the red stars of the main-sequence. The high-mass stars are the blue stars. The width of the main sequence reflects the evolution in a star's luminosity as the star consumes its hydrogen. The lower edge of the main sequence is called the zero-age main sequence (known by the acronym ZAMS) ; it is populated by stars that have just commenced their thermonuclear lives. A star begins its life as a protostar, evolving from high luminosity to it's ZAMS luminosity. Thermonuclear fusion of core hydrogen commences once the star reaches the ZAMS. From that point on, the star slowly becomes more luminous as it consumes its hydrogen, so it slowly moves up from the ZAMS. For instance, the Sun is estimated to be 40% more luminous today than when it was on the zero-age main sequence 4.5 billion years ago.
The stars that cluster in the luminous, red region of the Hertzsprung-Russell diagram are the red giant stars. They are stars that are burning helium at their core, having exhausted their core hydrogen. There are far fewer red giants than main-sequence stars, because a star consumes its helium much more rapidly than it does its hydrogen, which is reflected by the red giant's greater luminosity. Life as a red giant, on the other hand, is longer than life in the transition stage, when hydrogen fusion ceases in a main-sequence star, and the core of the star contracts to high density. This short stage is reflected by the near absence of stars between the main-sequence and the red giants on the diagram. One sees from this diagram that most red stars visible to the unaided eye are red giants.
Stars spend their thermonuclear days above the ZAMS. Not until they cease their thermonuclear fusion and shrink down to degenerate dwarfs or neutron stars do they fall below the ZAMS. The nearby degenerate dwarfs have absolute visual magnitudes that place them far below the main-sequence. For example, the companion star of Sirius is a degenerate dwarf with an absolute visual magnitude of only 11. No degenerate dwarf is visible to the unaided eye. With a higher limiting absolute magnitude, however, the degenerate dwarfs would form a third large grouping on the Hertzsprung-Russell diagram.
[1]Kovalevsky, J. ?First Results from Hipparcos.? In Annual Reviews of Astronomy and Astrophysics, edited by Geoffrey Burbidge, Allan Sandage, and Frank H. Shu, vol. 36. Palo Alto, California: Annual Reviews, 1998.
